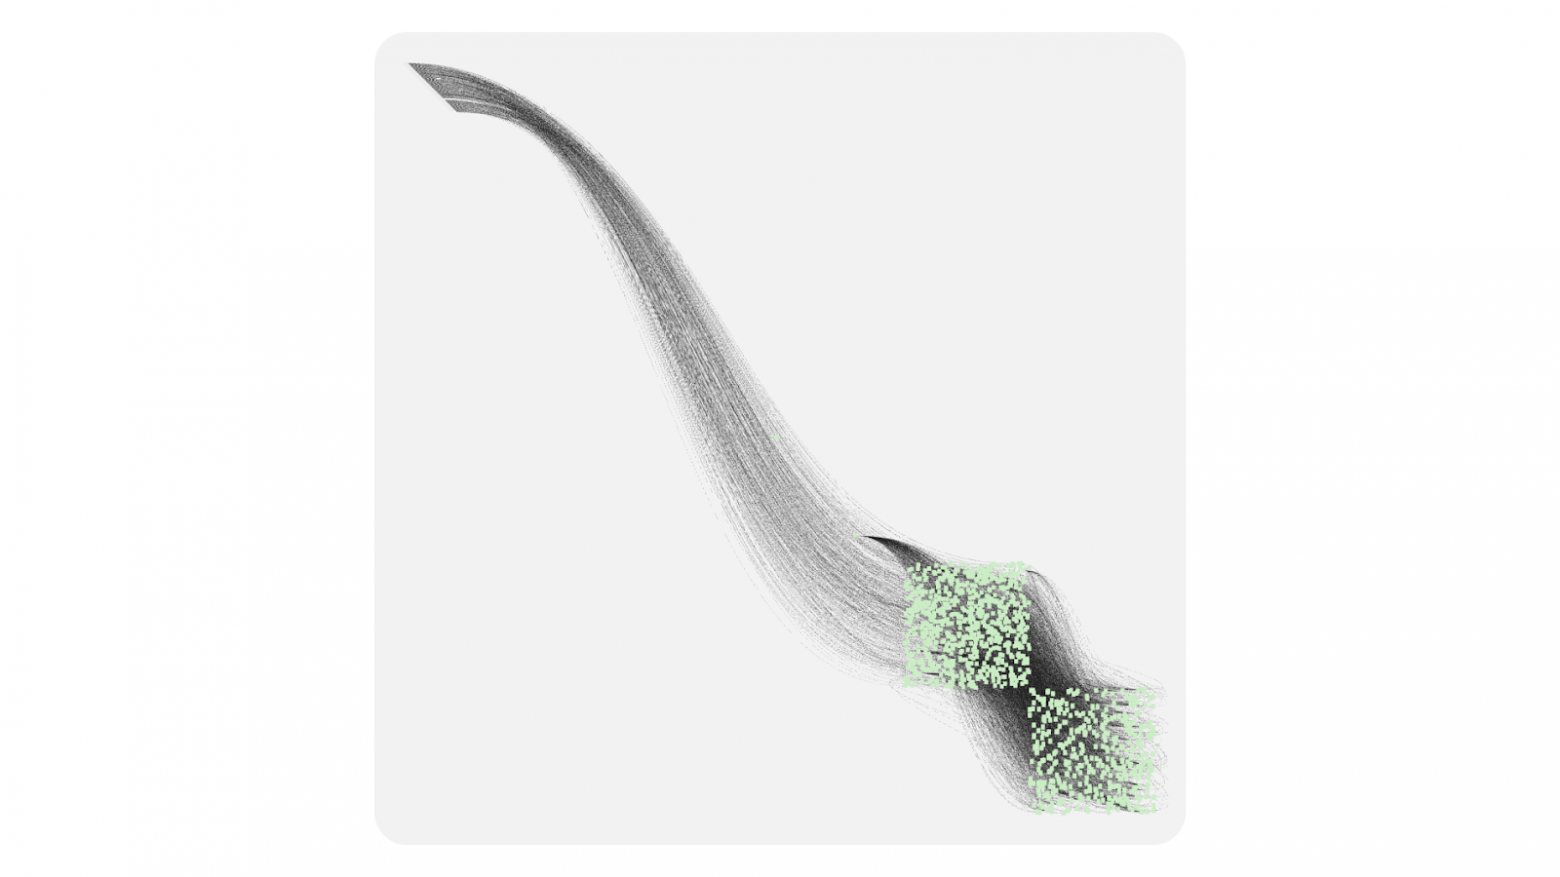
Image from Wikipedia R‑tree

Graph Visualization Library: How We Solved the Canvas vs. HTML Dilemma
Graph Visualization Library: How We Solved the Canvas vs. HTML Dilemma
August 7, 2025
17 mins to read
Hi! My name is Andrey, I’m a frontend developer on the User Experience team for Yandex infrastructure services. We develop Gravity UI—an open-source design system and React component library used by dozens of products inside the company and beyond. Today I’ll расскажу how we ran into the task of visualizing complex graphs, why existing solutions didn’t work for us, and how @gravity‑ui/graph ended up being created—a library we decided to open to the community.
This story started with a practical problem: we needed to render graphs with 10,000+ elements and interactive components. At Yandex there are many projects where users build complex data processing pipelines—from simple ETL processes to machine learning. When such pipelines are created programmatically, the number of blocks can reach tens of thousands.
Existing solutions didn’t work for us:
- HTML/SVG libraries look great and are convenient to develop with, but they start lagging already at hundreds of elements.
- Canvas solutions handle performance, but require a huge amount of code to build complex UI elements.
Drawing a button with rounded corners and a gradient in Canvas isn’t hard. However, problems appear when you need to create complex custom controls or layout—you’ll have to write dozens of lines of low-level drawing commands. Each UI element has to be programmed from scratch—from click handling to animations. And we needed full-fledged UI components: buttons, selects, input fields, drag-and-drop.
We decided not to choose between Canvas and HTML, but to use the best of both technologies. The idea was simple: automatically switch between modes depending on how close the user is looking at the graph.

Try it yourself
Where the task came from
Nirvana and its graphs
At Yandex we have a service called Nirvana for creating and running data-processing graphs (we wrote about it here back in 2018). It’s a large, popular service that has been around for a long time.
Some users build graphs by hand—dragging with the mouse, adding blocks, connecting them. With those graphs there’s no problem: there aren’t many blocks, and everything works great. But there are projects that create graphs programmatically. And that’s where the difficulties start: they can put up to 10,000 operations into a single graph. And you end up with this:

And this:
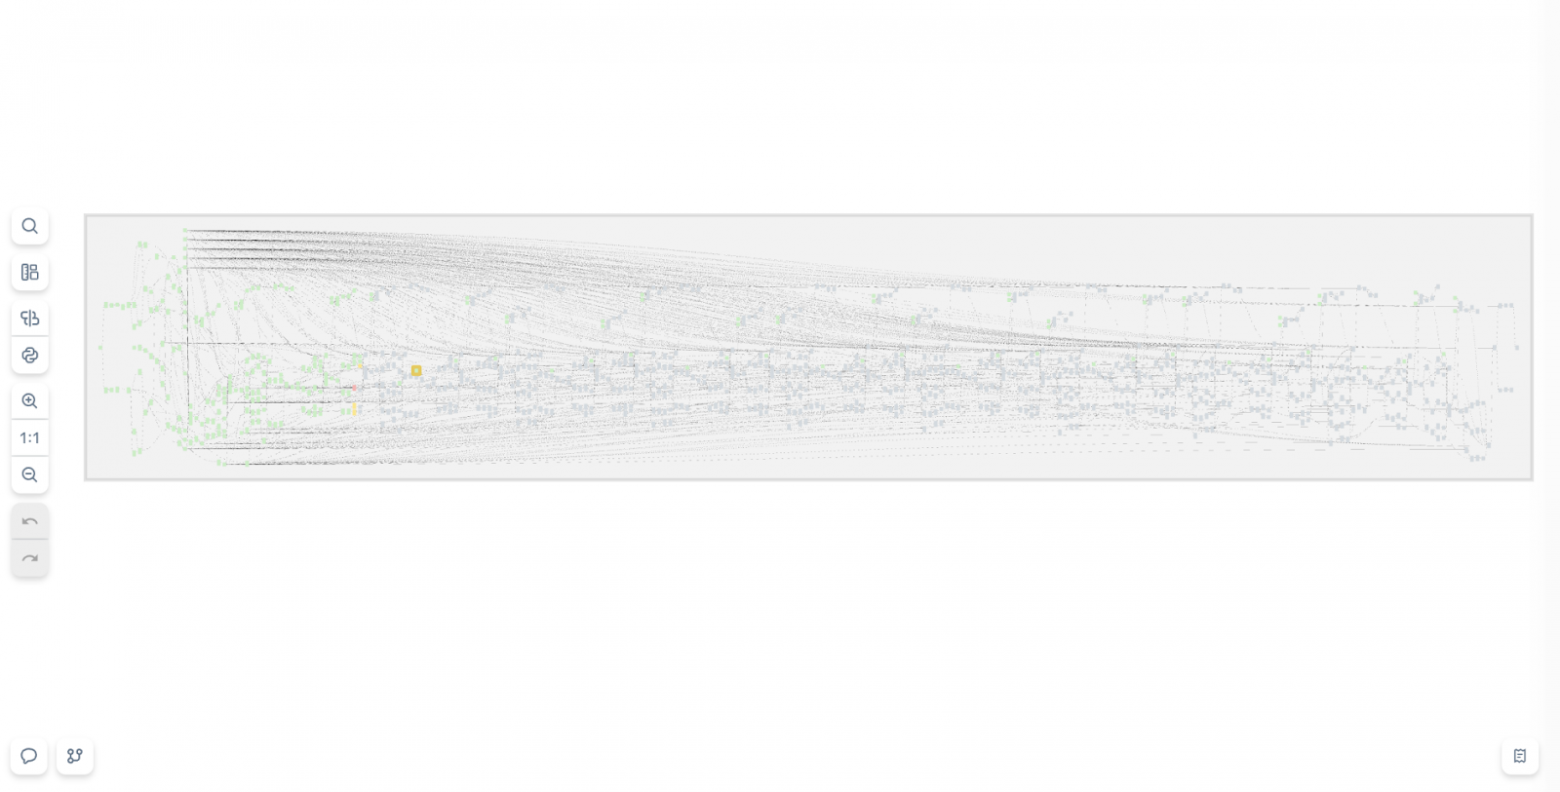
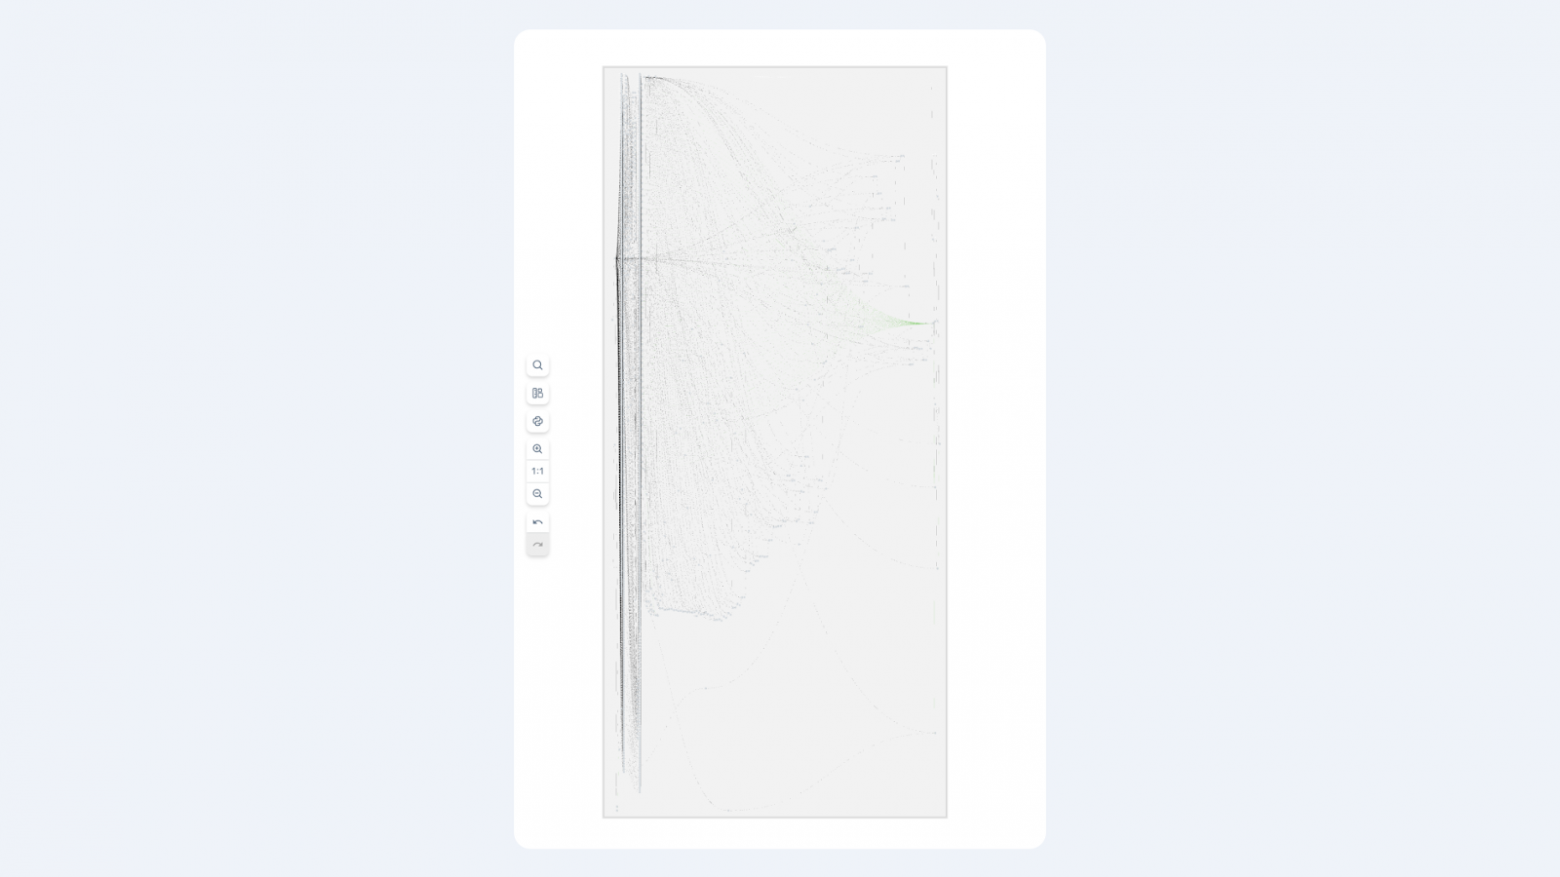
A typical HTML + SVG combo simply can’t handle such graphs. The browser starts lagging, memory leaks, the user suffers. We tried to solve the problem head-on: optimize HTML rendering, but sooner or later we hit physical limits—DOM is simply not designed for thousands of simultaneously visible floating interactive elements.
We needed a different solution, and in the browser we only had Canvas left. Only it can provide the required performance.
The first thought was to find a ready-made solution. It was 2017–2018, and we went through popular libraries for Canvas or graph rendering, but all solutions ran into the same problem: either use Canvas with primitive elements, or use HTML/SVG and sacrifice performance.
What if we don’t choose?
Level of Details: inspiration from GameDev
In GameDev and cartography there’s a great concept—Level of Details (LOD). This technique was born out of necessity—how do you show a huge world without killing performance?
The idea is simple: a single object can have several levels of detail depending on how closely it’s viewed. In games it’s especially noticeable:
- Far away you see mountains—simple polygons with a basic texture.
- As you get closer—details appear: grass, rocks, shadows.
- Even closer—you can see individual leaves on trees.
Nobody renders millions of grass polygons when the player is standing on a mountain peak looking into the distance.
In maps, the principle is the same—each zoom level has its own dataset and its own detail level:
- Continent scale—only countries are visible.
- Zooming into a city—streets and districts appear.
- Even closer—house numbers, cafés, bus stops.
We realized: the user doesn’t need interactive buttons at a large-scale view of a graph with 10,000 blocks—they won’t see them anyway and won’t be able to work with them.
Moreover, attempting to render 10,000 HTML elements at once will freeze the browser. But when the user zooms into a specific area, the number of visible blocks drops sharply—from 10,000 to, say, 50. That’s when resources are freed up for HTML components with rich interactivity.
Three levels in our Level of Details scheme
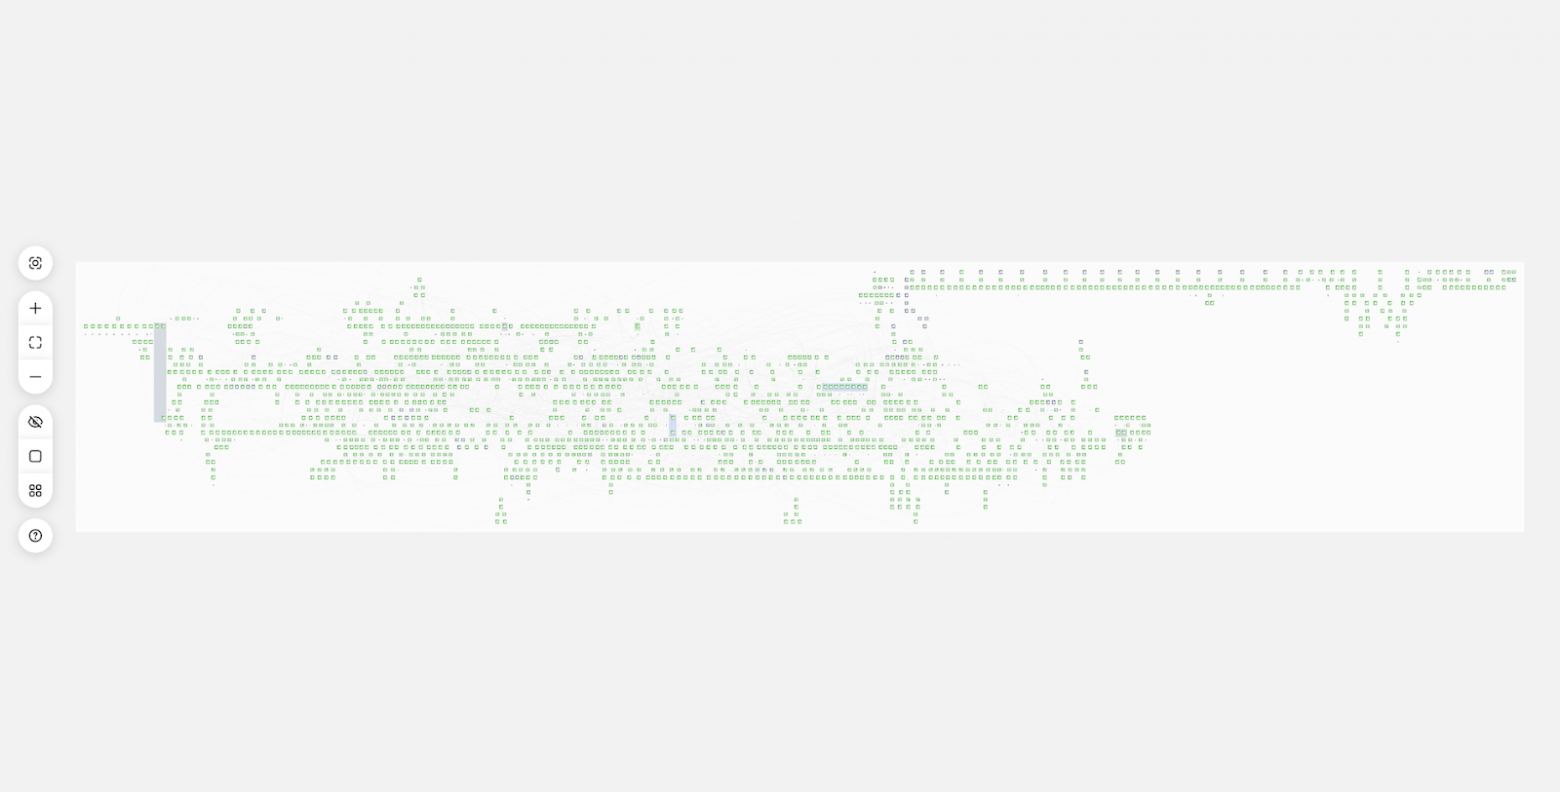
Minimalistic (scale 0.1–0.3) — Canvas with simple primitives
In this mode the user sees the overall architecture of the system: where the main groups of blocks are located and how they are connected. Each block is a simple rectangle with basic color coding. No text, buttons, or detailed icons. But you can comfortably render thousands of elements. At this level the user selects an area for detailed exploration.

Schematic (scale 0.3–0.7) — Canvas with details
Block names, status icons, and connection anchors appear. Text is rendered via the Canvas API—this is fast, but styling options are limited. Connections between blocks become more informative: you can show the direction of the data flow, the connection status. This is a transitional mode where Canvas performance is combined with basic informativeness.

Detailed (scale 0.7+) — HTML with full interactivity
Here blocks turn into full-fledged UI components: with control buttons, parameter fields, progress bars, selects. You can use any HTML/CSS capabilities and plug in UI libraries. In this mode the viewport typically contains no more than 20–50 blocks, which is comfortable for detailed work.

What if we use FPS to choose the level of detail?
We had approaches to selecting the level of detail based on FPS. But it turned out that this approach creates instability—when performance increases, the system switches to a more detailed mode, which lowers FPS and can cause switching back—and so on in a loop.
How we arrived at the solution
Okay, LOD is cool. But implementation requires Canvas for performance, and that’s a new headache. Drawing on Canvas isn’t very hard—problems appear when you need interactivity.
Problem: how do we understand where the user clicked?
In HTML it’s simple: click a button—you immediately get an event on that element. With Canvas it’s harder: you click the canvas—and then what? You have to figure out yourself which element the user clicked.
Basically there are three approaches:
- Pixel Testing (color picking),
- Geometric approach (simple iteration over all elements),
- Spatial Indexing (spatial index).
Pixel Testing (color picking)
The idea is simple: create a second invisible canvas, copy the scene there, but fill each element with a unique color that will be treated as the object ID. On click, read the pixel color under the mouse pointer via getImageData and thus get the element ID.
|
Pros |
Cons |
|
|
For small scenes the method is fine, but with 10,000+ elements the error rate becomes unacceptable—so we set Pixel Testing aside.
Geometric approach (simple iteration over all elements)
The idea is simple: iterate over all elements and check whether the click point lies inside the element.
|
Pros |
Cons |
|
|
Spatial Indexing
An evolution of the geometric approach. In the geometric approach we hit the number of elements. Spatial indexing algorithms try to group nearby elements in some way, mostly using trees, which makes it possible to reduce complexity to log n.
There are quite a lot of spatial indexing algorithms; we chose the R-Tree data structure via the rbush library.
R-Tree is, as the name suggests, a tree where each object is placed into a minimum bounding rectangle (MBR), and then those rectangles are grouped into larger rectangles. This produces a tree where each rectangle contains other rectangles.

To search in an RTree, we need to descend the tree (into the rectangles) until we reach a specific element. The path is chosen by checking intersection of the search rectangle with MBRs. All branches whose bounding boxes don’t even touch the search rectangle are discarded immediately—that’s why traversal depth is usually limited to 3–5 levels, and the search itself takes microseconds even with tens of thousands of elements.
This option works, although slower (O (log n) in the best case and O (n) in the worst) than pixel testing, but it is more accurate and less demanding on memory.
Event model
Based on the RTree, we can now build our event model. When the user clicks, a hit-test procedure runs: we form a 1×1 pixel rectangle at the cursor coordinates and search for its intersections in the R-Tree. Having obtained the element that this rectangle hits, we delegate the event to that element. If the element did not stop the event, then it is passed to its parent, and so on up to the root. The behavior of this model resembles the familiar event model in the browser. Events can be intercepted, prevented, or propagation can be stopped.
As I mentioned, during hit-testing we form a 1×1 pixel rectangle, which means we can form a rectangle of any size. And this will help us implement another very important optimization—Spatial Culling.
Spatial Culling
Spatial Culling is a rendering optimization technique aimed at not drawing what is not visible. For example, not drawing objects that are outside the camera space or that are occluded by other scene elements. Since our graph is drawn in 2D space, it is sufficient for us to not draw only those objects that are outside the camera’s visible area (viewport).
How it works:
- on each camera pan or zoom we form a rectangle equal to the current viewport;
- search for its intersections in the R-Tree;
- the result is a list of elements that are actually visible;
- we render only them; everything else is skipped.
This technique makes performance almost independent of the total number of elements: if 40 blocks fit in the frame, the library will draw exactly 40, not tens of thousands hidden beyond the screen. At far zoom levels, many elements fall into the viewport, so we draw lightweight Canvas primitives; as the camera zooms in, the number of elements decreases and freed resources allow switching to HTML mode with full detail.
Putting it all together, we get a simple scheme:
- Canvas is responsible for speed,
- HTML—for interactivity,
- R-Tree and Spatial Culling seamlessly combine them into a single system, allowing us to quickly understand which elements can be drawn on the HTML layer.
While the camera moves, the small viewport asks the R-Tree only for those objects that are actually in the frame. This approach allows us to draw truly large graphs, or at least have a performance reserve until the user narrows the viewport.
So at its core the library contains:
- a Canvas mode with simple primitives;
- an HTML mode with full detail;
- R-Tree and Spatial Culling for performance optimization;
- a familiar event model.
But that’s not enough for production: we need the ability to extend the library and customize it to our needs.
Customization
The library offers two complementary ways to extend and change behavior:
- Overriding base components. Change the logic of standard Block, Anchor, Connection.
- Extending via layers (Layers). Add fundamentally new functionality above/below the existing scene.
Overriding components
When you need to modify the appearance or behavior of existing elements, inherit from the base class and override key methods. Then register the component under your own name.
Block customization
For example, if you need to create a graph with progress bars on blocks—say, to display task execution status in a pipeline—you can easily customize the standard blocks:
import { CanvasBlock } from "@gravity‑ui/graph";

class ProgressBlock extends CanvasBlock {
  // Base block shape with rounded corners
  public override renderBody(ctx: CanvasRenderingContext2D): void {
    ctx.fillStyle = "#ddd";
    ctx.beginPath();
    ctx.roundRect(this.state.x, this.state.y, this.state.width, this.state.height, 12);
    ctx.fill();
    ctx.closePath();
  }

  public renderSchematicView(ctx: CanvasRenderingContext2D): void {
    const progress = this.state.meta?.progress || 0;

    // Draw the block base
    this.renderBody(ctx);

    // Progress bar with color indication
    const progressWidth = (this.state.width - 20) * (progress / 100);
    ctx.fillStyle = progress < 50 ? "#ff6b6b" : progress < 80 ? "#feca57" : "#48cae4";
    ctx.fillRect(this.state.x + 10, this.state.y + this.state.height - 15, progressWidth, 8);

    // Progress bar border
    ctx.strokeStyle = "#ddd";
    ctx.lineWidth = 1;
    ctx.strokeRect(this.state.x + 10, this.state.y + this.state.height - 15, this.state.width - 20, 8);

    // Text with percentages and name
    ctx.fillStyle = "#2d3436";
    ctx.font = "12px Arial";
    ctx.textAlign = "center";
    ctx.fillText(`${Math.round(progress)}%`, this.state.x + this.state.width / 2, this.state.y + 20);
    ctx.fillText(this.state.name, this.state.x + this.state.width / 2, this.state.y + 40);
  }
}
Connection customization
Similarly, if you need to change the behavior and appearance of connections—for example, to show data flow intensity between blocks—you can create a custom connection:
import { BlockConnection } from "@gravity-ui/graph";

class DataFlowConnection extends BlockConnection {
  public override style(ctx: CanvasRenderingContext2D) {
    // Get flow data from the connected blocks
    const sourceBlock = this.sourceBlock;
    const targetBlock = this.targetBlock;

    const sourceProgress = sourceBlock?.state.meta?.progress || 0;
    const targetProgress = targetBlock?.state.meta?.progress || 0;

    // Compute flow intensity based on block progress
    const flowRate = Math.min(sourceProgress, targetProgress);
    const isActive = flowRate > 10; // Flow is active when progress > 10%

    if (isActive) {
      // Active flow -- thick green line
      ctx.strokeStyle = "#00b894";
      ctx.lineWidth = Math.max(2, Math.min(6, flowRate / 20));
    } else {
      // Inactive flow -- dashed gray line
      ctx.strokeStyle = "#ddd";
      ctx.lineWidth = this.context.camera.getCameraScale();
      ctx.setLineDash([5, 5]);
    }

    return { type: "stroke" };
  }
}
Using custom components
Register the created components in the graph settings:
const customGraph = new Graph({
  blocks: [
    {
      id: "task1",
      is: "progress",
      x: 100,
      y: 100,
      width: 200,
      height: 80,
      name: "Data Processing",
      meta: { progress: 75 },
    },
    {
      id: "task2",
      is: "progress",
      x: 400,
      y: 100,
      width: 200,
      height: 80,
      name: "Analysis",
      meta: { progress: 30 },
    },
    {
      id: "task3",
      is: "progress",
      x: 700,
      y: 100,
      width: 200,
      height: 80,
      name: "Output",
      meta: { progress: 5 },
    },
  ],
  connections: [
    { sourceBlockId: "task1", targetBlockId: "task2" },
    { sourceBlockId: "task2", targetBlockId: "task3" },
  ],
  settings: {
    // Register custom blocks
    blockComponents: {
      'progress': ProgressBlock,
    },
    // Register a custom connection for all links
    connection: DataFlowConnection,
    useBezierConnections: true,
  },
});

customGraph.setEntities({
  blocks: [
    {
    is: 'progress',
    id: '1',
    name: "progress block',
    x: 10,
    y: 10,
    width: 10,
    height: 10,
    anchors: [],
    selected: false,
    }
  ]
})

customGraph.start();
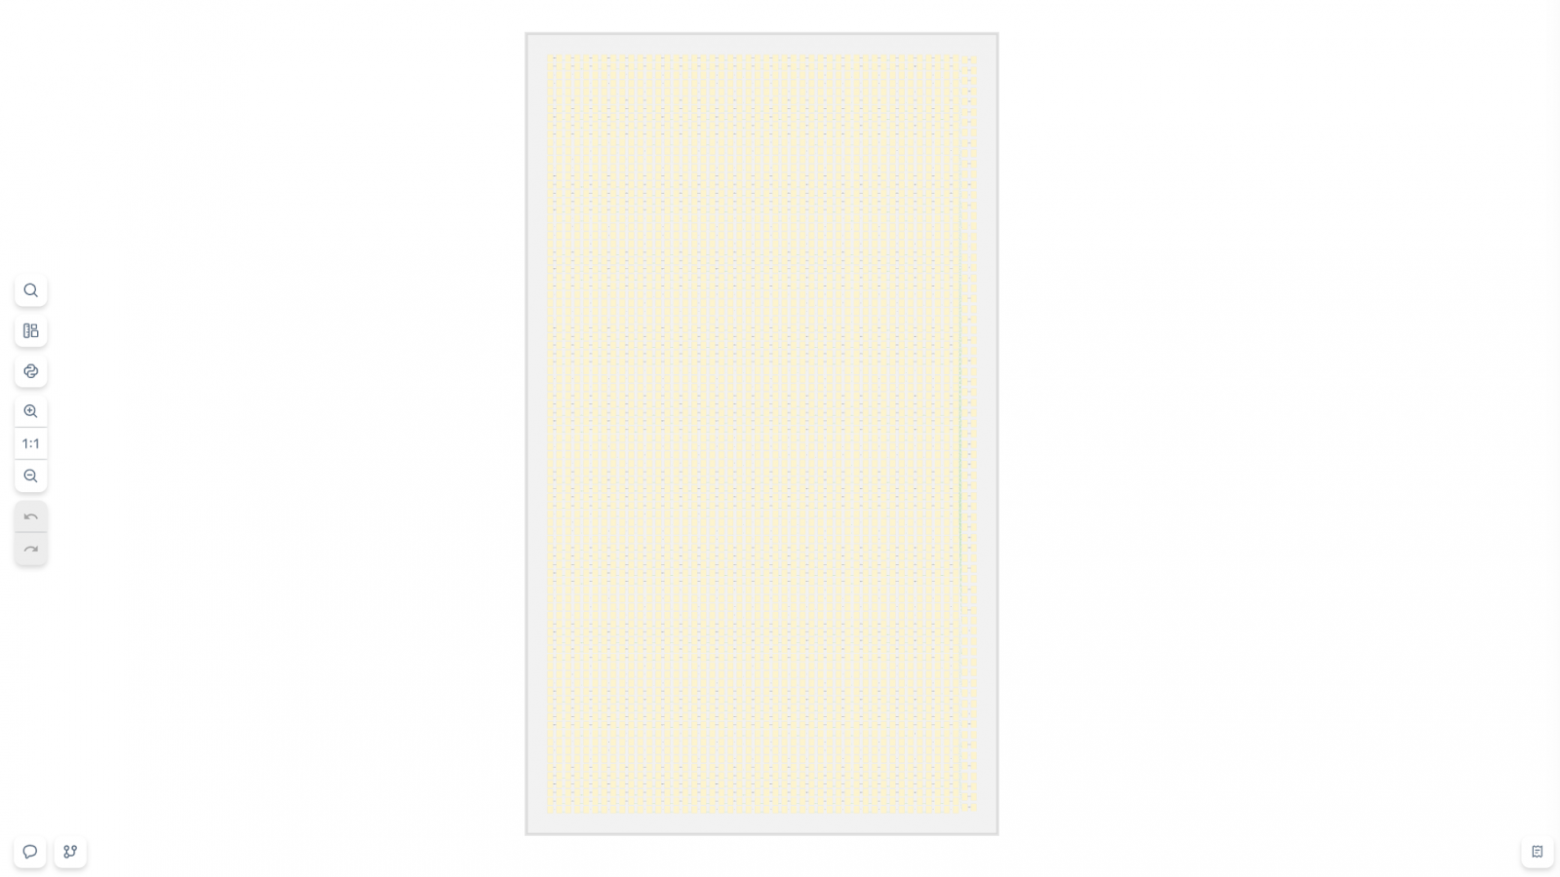
Result
The result is a graph where:
- blocks show current progress with color indication;
- connections visualize data flow: active flows are green and thick, inactive ones are gray and dashed;
- when zooming, blocks automatically switch to HTML mode with full interactivity.
Extending with layers
Layers are additional Canvas or HTML elements that are inserted into the graph “space”. Essentially, each layer is a separate rendering channel that can contain its own canvas for fast graphics or an HTML container for complex interactive elements.
By the way, this is exactly how React integration works in our library: React components are rendered into the HTML layer via a React Portal.
Layer architecture
Layers are another key solution to the Canvas vs HTML dilemma. Layers synchronize the positions of Canvas and HTML elements, ensuring they overlay correctly. This makes it possible to seamlessly switch between Canvas and HTML while staying in a single coordinate space. The graph consists of independent layers stacked on top of each other:

Layers can work in two coordinate systems:
-
Attached to the graph (
transformByCameraPosition: true):- elements move together with the camera,
- blocks, connections, graph elements.
-
Fixed on the screen (
transformByCameraPosition: false):- stay in place when panning,
- toolbars, legends, UI controls.
How React integration works
A layer with React integration is quite illustrative for demonstrating what layers are. First, let’s look at a component that highlights the list of blocks that are in the camera’s visible area. To do this, we need to subscribe to camera changes and after each change check the intersection of the camera viewport with the elements’ hitboxes.
import { Graph } from "@gravity-ui/graph";

const BlocksList = ({ graph, renderBlock }: { graph: Graph, renderBlock: (graph: Graph, block: TBlock) => React.JSX.Element }) => {
  const [blocks, setBlocks] = useState([]);

  const updateVisibleList = useCallback(() => {
    const cameraState = graph.cameraService.getCameraState();
    const CAMERA_VIEWPORT_TRESHOLD = 0.5;
    const x = -cameraState.relativeX - cameraState.relativeWidth * CAMERA_VIEWPORT_TRESHOLD;
    const y = -cameraState.relativeY - cameraState.relativeHeight * CAMERA_VIEWPORT_TRESHOLD;
    const width = -cameraState.relativeX + cameraState.relativeWidth * (1 + CAMERA_VIEWPORT_TRESHOLD) - x;
    const height = -cameraState.relativeY + cameraState.relativeHeight * (1 + CAMERA_VIEWPORT_TRESHOLD) - y;

    const blocks = graph
      .getElementsOverRect(
        {
          x,
          y,
          width,
          height,
        }, // defines the area in which the list of blocks will be searched
        [CanvasBlock] // defines the element types that will be searched in the camera viewport
      ).map((component) => component.connectedState); // Get the list of block models

      setBlocks(blocks);
  });

    useGraphEvent(graph, "camera-change", ({ scale }) => {
      if (scale >= 0.7) {
        // If the scale is greater than 0.7, then update the list of blocks
        updateVisibleList()
        return;
      }
      setBlocks([]);
    });

    return blocks.map(block => <React.Fragment key={block.id}>{renderBlock(graphObject, block)}</React.Fragment>)
}
Now let’s look at the description of the layer itself that will use this component.
import { Layer } from '@gravity-ui/graph';

class ReactLayer extends Layer {
  constructor(props: TReactLayerProps) {
    super({
      html: {
        zIndex: 3, // bring the layer above the other layers
        classNames: ["no-user-select"], // add a class to disable text selection
        transformByCameraPosition: true, // layer is attached to the camera - now the layer will move together with the camera
      },
      ...props,
    });
  }

  public renderPortal(renderBlock: <T extends TBlock>(block: T) => React.JSX.Element) {
    if (!this.getHTML()) {
      return null;
    }

    const htmlLayer = this.getHTML() as HTMLDivElement;

    return createPortal(
      React.createElement(BlocksList, {
        graph: this.context.graph,
        renderBlock: renderBlock,
      }),
      htmlLayer,
    );
  }
}
Now we can use this layer in our application.
import { Flex } from "@gravity-ui/uikit";

const graph = useMemo(() => new Graph());
const containerRef = useRef<HTMLDivElement>();

useEffect(() => {
    if (containerRef.current) {
      graph.attach(containerRef.current);
    }

    return () => {
      graph.detach();
    };
  }, [graph, containerRef]);


const reactLayer = useLayer(graph, ReactLayer, {});

const renderBlock = useCallback((graph, block) => <Block graph={graph} block={block}>{block.name}</Block>)

  return (
    <div>
      <div style={{ position: "absolute", overflow: "hidden", width: "100%", height: "100%" }} ref={containerRef}>
        {graph && reactLayer && reactLayer.renderPortal(renderBlock)}
      </div>
    </div>
  );
Overall, everything is quite simple. Nothing described above needs to be written by yourself—everything is already implemented and ready to use.
Our graph library: what the benefits are and how to use it
When we started working on the library, the main question was: how do we make it so that a developer doesn’t have to choose between performance and development convenience? The answer turned out to be automating that choice.
Benefits
Performance + convenience
@gravity‑ui/graph automatically switches between Canvas and HTML depending on the scale. This means you get:
- Stable 60 FPS on graphs with thousands of elements.
- The ability to use full-fledged HTML components with rich interactivity when viewing in detail.
- A single event model regardless of rendering method—click, mouseenter work the same on Canvas and in HTML.
Compatibility with UI libraries
One of the main advantages is compatibility with any UI libraries. If your team uses:
- Gravity UI,
- Material‑UI,
- Ant Design,
- custom components.
…then you don’t need to give them up! When you zoom in, the graph automatically switches to HTML mode, where familiar Button, Select, DatePicker in the color theme you need work exactly the same as in a regular React app.
Framework agnostic
Although we implemented the basic HTML renderer using React, we tried to develop the library so that it remains framework-agnostic. This means that if necessary, you can fairly easily implement a layer integrating your favorite framework.
Are there any alternatives?
There are quite a lot of solutions on the market for graph rendering, from paid solutions like yFiles, JointJS, to open-source solutions Foblex Flow, baklavajs, jsPlumb. But for comparison we consider @antv/g6 and React Flow as the most popular tools. Each of them has its own features.
React Flow is a good library tailored for building node-based interfaces. It has very extensive capabilities, but due to using svg and html its performance is rather modest. The library is good when you’re confident graphs won’t exceed 100–200 blocks.
In turn, @antv/g6 has a ton of features; it supports Canvas and in particular WebGL. Comparing @antv/g6 and @gravity‑ui/graph directly is probably not quite correct: their team is more focused on building graphs and charts—but node-based UI is also supported. So antv/g6 is suitable if you care not only about a node-based interface but also about drawing charts.
Although @antv/g6 can do both canvas/webgl and html/svg, you’ll have to manage the switching rules manually, and you need to do it correctly. Performance-wise it is much faster than React Flow, but there are still questions about the library. While WebGL support is claimed, if you look at their stress test, it’s noticeable that on 60k nodes the library can’t deliver dynamics—on a MacBook M3 rendering a single frame took 4 seconds. For comparison, our stress test on 111k nodes and 109k connections on the same Macbook M3: rendering the entire graph scene takes ~60ms, which yields ~15–20 FPS. That’s not very much, but with Spatial Culling there is an option to limit the viewport and thus improve responsiveness. Although the maintainers stated they want to achieve rendering 100k nodes at 30 FPS, apparently they have not managed to do so yet.
Another point where @gravity‑ui/graph wins is bundle size.
|
Bundle size Minified |
Bundle size Minified + Gzipped |
|
|
@antv/g6 bundlephobia |
1.1 MB |
324.5 kB |
|
react flow bundlephobia |
181.2 kB |
56.4 kB |
|
@gravity-ui/graph bundlephobia |
2.2 kB |
672 B |
Although both libraries are quite strong in terms of performance or integration convenience, @gravity‑ui/graph has a number of advantages—it can provide performance on truly large graphs while preserving UI/UX for the user and simplifying development.
Plans for the future
The library already has sufficient performance headroom for most tasks, so in the near future we will focus more on developing the ecosystem around the library—building layers (plugins), integrations for other libraries and frameworks (Angular/Vue/Svelte, …etc), adding support for touch devices, adaptation for mobile browsers, and generally improving UX/DX.
Try it and join in
In the repository you’ll find a fully working library:
- Canvas + R-Tree core (≈ 30K lines of code),
- React integration,
- Storybook with examples.
You can install the library in one line:
npm install @gravity-ui/graph
For quite a long time, the library that is now called @gravity‑ui/graph was an internal tool inside Nirvana, and the chosen approach has proven itself well. Now we want to share our work and help developers outside draw their graphs more easily, faster, and more efficiently.
We want to standardize approaches to displaying complex graphs in the open-source community—too many teams reinvent the wheel or struggle with unsuitable tools.
That’s why it’s very important for us to collect your feedback—different projects bring different edge cases that help evolve the library. This will help us refine the library and grow the Gravity UI ecosystem faster.

Andrey Shchetinin
Senior Frontend Developer
Sign in to save this post