Timeline
一个基于 React 的库,用于使用 canvas 渲染构建交互式时间线可视化。
@gravity-ui/timeline 


一个基于 React 的库,用于构建具有 Canvas 渲染的交互式时间轴可视化。
文档
详情请参阅 文档。
预览
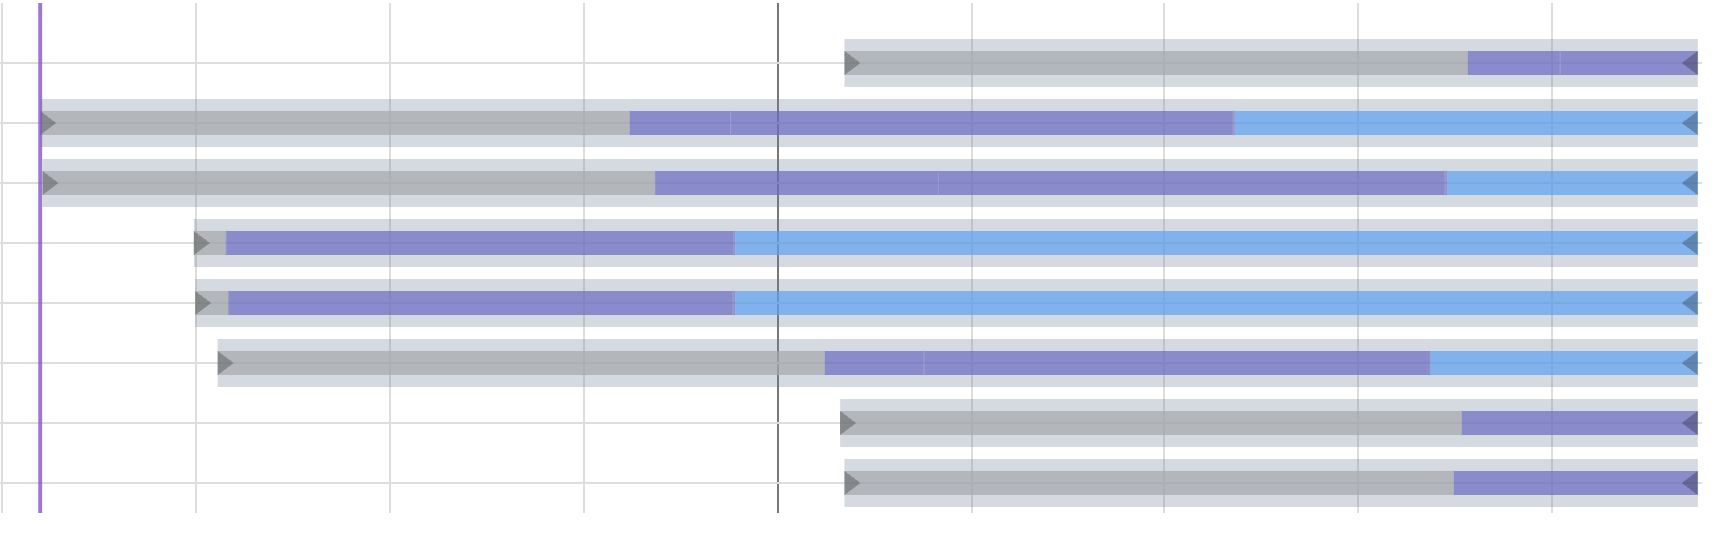
带有事件和轴的基本时间轴:
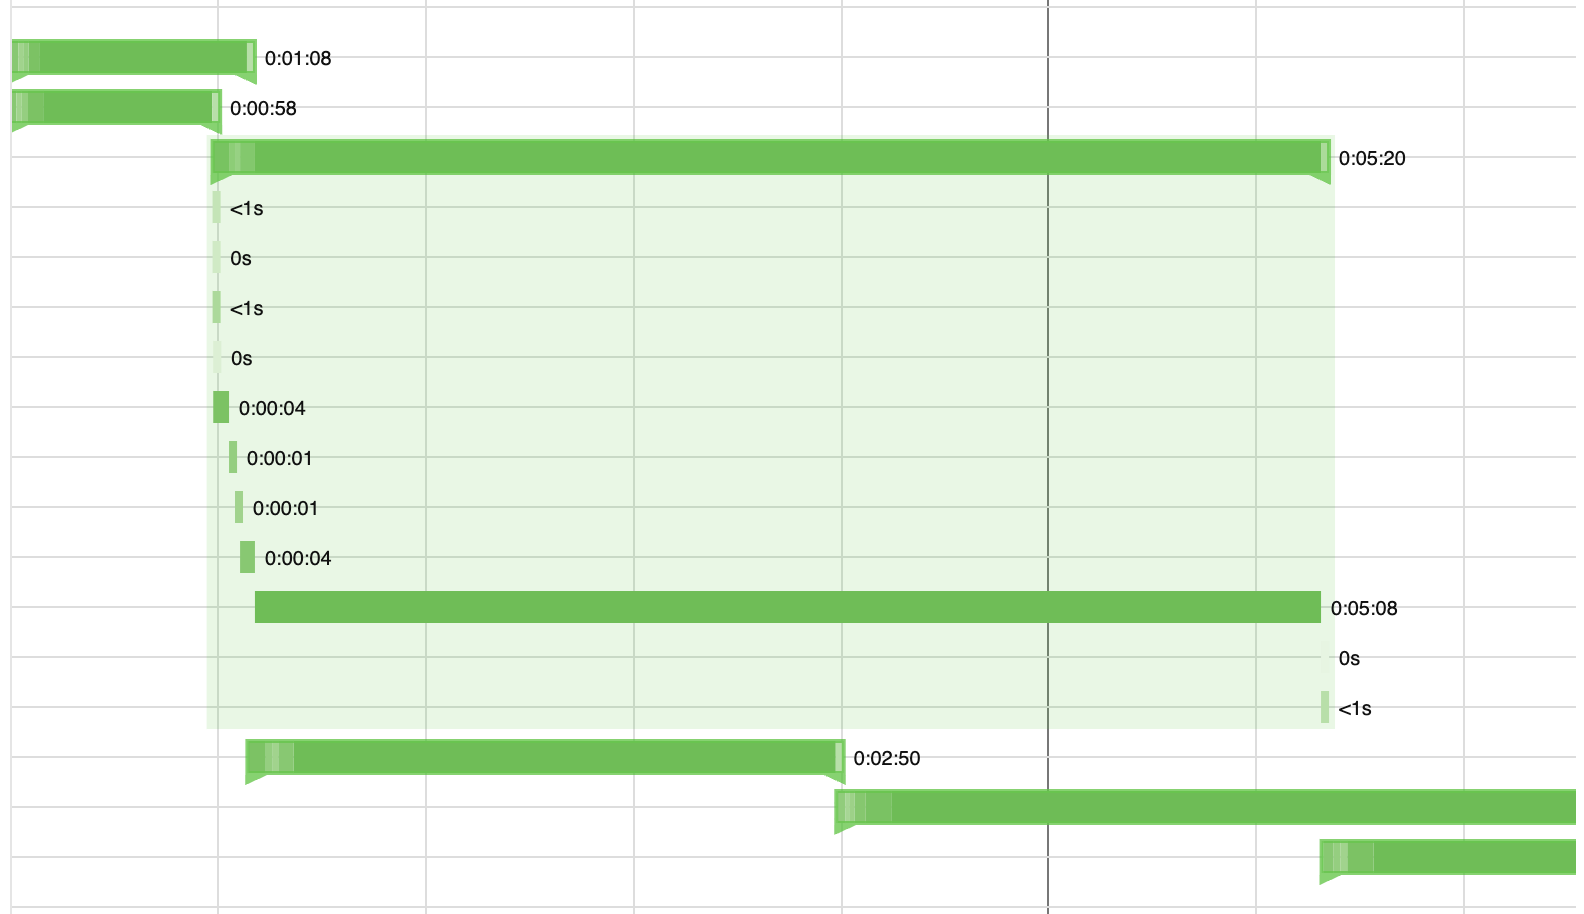
自定义渲染,支持可展开的嵌套事件(NestedEvents 示例):
特性
- 基于 Canvas 的渲染,性能卓越
- 支持缩放和平移的交互式时间轴
- 支持事件、标记、区域、轴和网格
- 背景区域,用于视觉组织和时间段高亮显示
- 智能标记分组,并自动缩放到组 - 点击分组标记可缩放到其独立组件
- 虚拟化渲染,提高处理大型数据集时的性能(仅当时间轴内容超出视口时激活)
- 可自定义的外观和行为
- 支持 TypeScript,提供完整的类型定义
- React 集成,包含自定义 Hooks
安装
npm install @gravity-ui/timeline
用法
可以在 React 应用中使用时间轴组件,基本设置如下:
import { TimelineCanvas, useTimeline } from '@gravity-ui/timeline/react';

const MyTimelineComponent = () => {
  const { timeline, api, start, stop } = useTimeline({
    settings: {
      start: Date.now(),
      end: Date.now() + 3600000, // 1 小时后
      axes: [],
      events: [],
      markers: [],
      sections: []
    },
    viewConfiguration: {
      // 可选的视图配置
    }
  });

  // timeline - Timeline 实例
  // api - CanvasApi 实例 (与 timeline.api 相同)
  // start - 用于使用 canvas 初始化时间轴的函数
  // stop - 用于销毁时间轴的函数

  return (
    <div style={{ width: '100%', height: '100%' }}>
      <TimelineCanvas timeline={timeline} />
    </div>
  );
};
轴结构
每个轴具有以下结构:
type TimelineAxis = {
  id: string;          // 唯一的轴标识符
  tracksCount: number; // 轴中的轨道数量
  top: number;         // 垂直位置 (px)
  height: number;      // 每个轨道的高度 (px)
};
区域结构
每个区域需要以下结构:
type TimelineSection = {
  id: string;               // 唯一的区域标识符
  from: number;             // 开始时间戳
  to?: number;              // 可选的结束时间戳 (默认为时间轴结束时间)
  color: string;            // 区域的背景颜色
  hoverColor?: string;      // 区域悬停时的可选颜色
  renderer?: AbstractSectionRenderer; // 可选的自定义渲染器 (从包中导出)
};
区域为时间段提供背景着色,并帮助在视觉上组织时间轴内容:
const MyTimelineComponent = () => {
  const { timeline } = useTimeline({
    settings: {
      start: Date.now(),
      end: Date.now() + 3600000,
      axes: [],
      events: [],
      markers: [],
      sections: [
        {
          id: 'morning',
          from: Date.now(),
          to: Date.now() + 1800000, // 30 分钟
          color: 'rgba(255, 235, 59, 0.3)', // 半透明黄色
          hoverColor: 'rgba(255, 235, 59, 0.4)'
        },
        {
          id: 'afternoon',
          from: Date.now() + 1800000,
          // 未指定 'to' - 延伸至时间轴结束
          color: 'rgba(76, 175, 80, 0.2)', // 半透明绿色
          hoverColor: 'rgba(76, 175, 80, 0.3)'
        }
      ]
    },
    viewConfiguration: {
      sections: {
        hitboxPadding: 2 // 悬停检测填充区域
      }
    }
  });

  return <TimelineCanvas timeline={timeline} />;
};
标记结构
每个标记需要以下结构:
type TimelineMarker = {
  time: number;           // 标记位置的时间戳
  color: string;          // 标记线的颜色
  activeColor: string;    // 标记被选中时的颜色 (必需)
  hoverColor: string;     // 标记悬停时的颜色 (必需)
  lineWidth?: number;     // 可选的标记线宽度
  label?: string;         // 可选的标签文本
  labelColor?: string;    // 可选的标签颜色
  renderer?: AbstractMarkerRenderer; // 可选的自定义渲染器
  nonSelectable?: boolean;// 标记是否可被选中
  group?: boolean;        // 标记是否代表一个组
};
标记分组和缩放
时间轴会自动将彼此靠近的标记进行分组,并提供缩放功能:
const MyTimelineComponent = () => {
  const { timeline } = useTimeline({
    settings: {
      start: Date.now(),
      end: Date.now() + 3600000,
      axes: [],
      events: [],
      markers: [
        // 这些标记将被分组在一起
        { time: Date.now(), color: '#ff0000', activeColor: '#ff5252', hoverColor: '#ff1744', label: '事件 1' },
        { time: Date.now() + 1000, color: '#ff0000', activeColor: '#ff5252', hoverColor: '#ff1744', label: '事件 2' },
        { time: Date.now() + 2000, color: '#ff0000', activeColor: '#ff5252', hoverColor: '#ff1744', label: '事件 3' },
      ]
    },
    viewConfiguration: {
      markers: {
        collapseMinDistance: 8,        // 将相距 8 像素内的标记分组
        groupZoomEnabled: true,        // 点击分组时启用缩放
        groupZoomPadding: 0.3,        // 分组周围的填充为 30%
        groupZoomMaxFactor: 0.3,      // 最大缩放因子
      }
    }
  });

  // 监听分组缩放事件
  useTimelineEvent(timeline, 'on-group-marker-click', (data) => {
    console.log('分组已缩放:', data);
  });

  return <TimelineCanvas timeline={timeline} />;
};
工作原理
时间轴组件基于 React 构建,提供了一种灵活的方式来创建交互式时间轴可视化。其工作原理如下:
组件架构
时间轴实现为一个 React 组件,可以通过两个主要对象进行配置:
-
TimelineSettings: 控制时间轴的核心行为和外观
start: 时间轴的开始时间end: 时间轴的结束时间axes: 轴配置数组(参见下方结构)events: 事件配置数组markers: 标记配置数组sections: 区段配置数组
-
ViewConfiguration: 管理视觉表示和交互设置
- 控制外观、缩放级别和交互行为
- 可以自定义或使用默认值
事件处理
时间轴组件支持多种交互事件:
on-click: 点击时间轴时触发on-context-click: 右键点击/上下文菜单时触发on-select-change: 选择更改时触发on-hover: 鼠标悬停在时间轴元素上时触发on-leave: 鼠标离开时间轴元素时触发
事件处理示例:
import { useTimelineEvent } from '@gravity-ui/timeline/react';

const MyTimelineComponent = () => {
  const { timeline } = useTimeline({ /* ... */ });

  useTimelineEvent(timeline, 'on-click', (data) => {
    console.log('时间轴被点击:', data);
  });

  useTimelineEvent(timeline, 'on-select-change', (data) => {
    console.log('选择已更改:', data);
  });

  return <TimelineCanvas timeline={timeline} />;
};
React 集成
该组件使用自定义钩子来管理时间轴:
-
useTimeline: 管理时间轴实例及其生命周期- 创建并初始化时间轴
- 在组件卸载时处理清理
- 提供对时间轴实例的访问
-
useTimelineEvent: 处理事件订阅和清理- 管理事件监听器的生命周期
- 在卸载时自动清理监听器
当组件卸载时,该组件会自动处理时间轴实例的清理和销毁。
事件结构
时间轴中的事件遵循此结构:
type TimelineEvent = {
  id: string;             // 唯一标识符
  from: number;           // 开始时间戳
  to?: number;            // 结束时间戳(点事件可选)
  axisId: string;         // 事件所属的轴的 ID
  trackIndex: number;     // 轴轨道中的索引
  renderer?: AbstractEventRenderer; // 可选的自定义渲染器
  color?: string;         // 可选的事件颜色
  selectedColor?: string; // 可选的选中状态颜色
};
直接 TypeScript 用法
Timeline 类可以直接在 TypeScript 中使用,无需 React。这对于与框架或其他 JavaScript 应用程序集成非常有用:
import { Timeline } from '@gravity-ui/timeline';

const timestamp = Date.now();

// 创建一个时间轴实例
const timeline = new Timeline({
  settings: {
    start: timestamp,
    end: timestamp + 3600000, // 从现在开始 1 小时
    axes: [
      {
        id: 'main',
        tracksCount: 3,
        top: 0,
        height: 100
      }
    ],
    events: [
      {
        id: 'event1',
        from: timestamp + 1800000, // 从现在开始 30 分钟
        to: timestamp + 2400000,   // 从现在开始 40 分钟
        label: '示例事件',
        axisId: 'main'
      }
    ],
    markers: [
      {
        id: 'marker1',
        time: timestamp + 1200000, // 从现在开始 20 分钟
        label: '重要节点',
        color: '#ff0000',
        activeColor: '#ff5252',
        hoverColor: '#ff1744'
      }
    ],
    sections: [
      {
        id: 'section1',
        from: timestamp,
        to: timestamp + 1800000, // 前 30 分钟
        color: 'rgba(33, 150, 243, 0.2)', // 浅蓝色背景
        hoverColor: 'rgba(33, 150, 243, 0.3)'
      }
    ]
  },
  viewConfiguration: {
    // 可选:自定义视图设置
    zoomLevels: [1, 2, 4, 8, 16],
    hideRuler: false,
    showGrid: true
  }
});

// 使用 canvas 元素初始化
const canvas = document.querySelector('canvas');
if (canvas instanceof HTMLCanvasElement) {
  timeline.init(canvas);
}

// 添加事件监听器
timeline.on('on-click', (detail) => {
  console.log('时间轴被点击:', detail);
});

timeline.on('on-select-change', (detail) => {
  console.log('选择已更改:', detail);
});

// 完成后清理
timeline.destroy();
Timeline 类提供了一个丰富的 API 来管理时间轴:
- 事件管理:
// 添加事件监听器
timeline.on('eventClick', (detail) => {
  console.log('事件被点击:', detail);
});
```markdown
  // 移除事件监听器
  const handler = (detail) => console.log(detail);
  timeline.on('eventClick', handler);
  timeline.off('eventClick', handler);

  // 触发自定义事件
  timeline.emit('customEvent', { data: 'custom data' });
- 时间轴控制:
// 更新时间轴数据
timeline.api.setEvents([
  {
    id: 'newEvent',
    from: Date.now(),
    to: Date.now() + 3600000,
    label: '新事件',
    axisId: 'main',
    trackIndex: 0
  }
]);

// 更新轴
timeline.api.setAxes([
  {
    id: 'newAxis',
    tracksCount: 2,
    top: 0,
    height: 80
  }
]);

// 更新标记
timeline.api.setMarkers([
  {
    id: 'newMarker',
    time: Date.now(),
    label: '新标记',
    color: '#00ff00',
    activeColor: '#4caf50',
    hoverColor: '#2e7d32'
  }
]);

// 更新区域
timeline.api.setSections([
  {
    id: 'newSection',
    from: Date.now(),
    to: Date.now() + 1800000,
    color: 'rgba(255, 193, 7, 0.2)', // 淡琥珀色背景
    hoverColor: 'rgba(255, 193, 7, 0.3)'
  }
]);

// 更新视图配置(与当前配置合并)
timeline.api.setViewConfiguration({ hideRuler: true });
实时示例
在我们的 Storybook 中探索交互式示例:
- 基础时间轴 - 带有事件和轴的简单时间轴
- 无限时间轴 - 带有事件和轴的无限时间轴
- 标记 - 带垂直标记和标签的时间轴
- 自定义事件 - 带自定义事件渲染的时间轴
- 集成 - RangeDateSelection、DragHandler、NestedEvents、Popup、List
开发
Storybook
本项目包含 Storybook,用于组件开发和文档。
运行 Storybook:
npm run storybook
这将启动 Storybook 开发服务器,端口为 6006。您可以通过 http://localhost:6006 访问它。
构建 Storybook 的静态版本以进行部署:
npm run build-storybook
许可证
MIT