Graph
動的なスケール対応の詳細化を備えた高性能グラフレンダラー。
@gravity-ui/graph · 


両方の長所を兼ね備えたグラフ描画ライブラリです。
- 全体像を表示する際の高パフォーマンスのために Canvas を使用
- ズームイン時のリッチなインタラクションのために HTML/React を使用
パフォーマンスとインタラクティブ性のどちらかを選択する必要はもうありません。大規模な図、フローチャート、ノードベースのエディタに最適です。
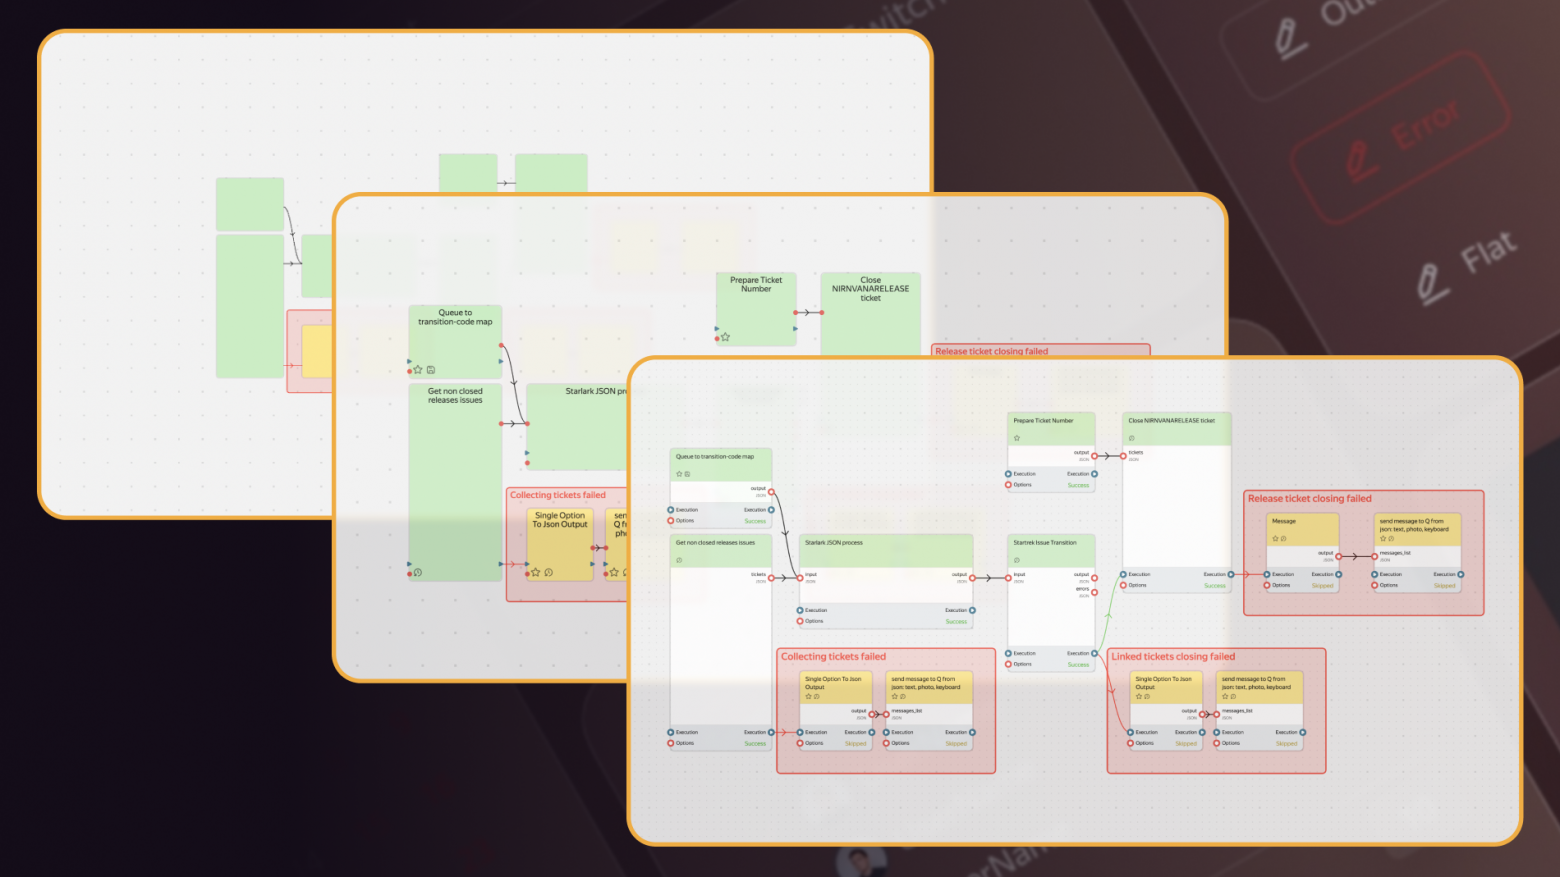
モチベーション
現代のウェブアプリケーションでは、複雑な描画とインタラクションが求められることがよくありますが、既存のソリューションは通常、単一のレンダリング技術に焦点を当てています。
- Canvas は複雑なグラフィックスに対して高いパフォーマンスを提供しますが、テキスト処理やインタラクションには制限があります。
- HTML DOM はインターフェースには便利ですが、複雑なグラフィックスや多数の要素には効率が悪いです。
@gravity-ui/graph は、ズームレベルに応じて Canvas と HTML を自動的に切り替えることで、この問題を解決します。
- ズームアウト時: グラフ全体を効率的にレンダリングするために Canvas を使用
- 中程度のズーム: 基本的なインタラクションを備えた概略図を表示
- ズームイン時: リッチなインタラクションのために HTML/React コンポーネントに切り替え
仕組み
このライブラリは、Canvas と React コンポーネント間の遷移を自動的に管理するスマートなレンダリングシステムを使用しています。
- 低いズームレベルでは、パフォーマンスのためにすべて Canvas 上にレンダリングされます。
- 詳細表示にズームインすると、
GraphCanvasコンポーネントは以下の処理を行います。- カメラのビューポートとスケールの変更を追跡します。
- 現在のビューポートで表示されているブロックを(スムーズなスクロールのためのパディングを含めて)計算します。
- 表示されているブロックに対してのみ React コンポーネントをレンダリングします。
- スクロールまたはズーム時にリストを自動的に更新します。
- ズームアウト時に React コンポーネントを削除します。
// React コンポーネントのレンダリング例
const MyGraph = () => {
  return (
    <GraphCanvas
      graph={graph}
      renderBlock={(graph, block) => (
        <MyCustomBlockComponent
          graph={graph}
          block={block}
        />
      )}
    />
  );
};
インストール
npm install @gravity-ui/graph
例
React の例
import React, { useEffect } from "react";
import type { Graph, TBlock } from "@gravity-ui/graph";
import { EAnchorType, GraphState } from "@gravity-ui/graph";
import { GraphCanvas, GraphBlock, useGraph } from "@gravity-ui/graph/react";

const config = {};

export function GraphEditor() {
  const { graph, setEntities, start } = useGraph(config);

  useEffect(() => {
    setEntities({
      blocks: [
        {
          is: "block-action",
          id: "action_1",
          x: -100,
          y: -450,
          width: 126,
          height: 126,
          selected: true,
          name: "Block #1",
          anchors: [
            {
              id: "out1",
              blockId: "action_1",
              type: EAnchorType.OUT,
              index: 0,
            },
          ],
        },
        {
          id: "action_2",
          is: "block-action",
          x: 253,
          y: 176,
          width: 126,
          height: 126,
          selected: false,
          name: "Block #2",
          anchors: [
            {
              id: "in1",
              blockId: "action_2",
              type: EAnchorType.IN,
              index: 0,
            },
          ],
        },
      ],
      connections: [
        {
          sourceBlockId: "action_1",
          sourceAnchorId: "out1",
          targetBlockId: "action_2",
          targetAnchorId: "in1",
        },
      ],
    });
  }, [setEntities]);

  const renderBlockFn = (graph: Graph, block: TBlock) => {
    return (
      <GraphBlock graph={graph} block={block}>
        {block.id}
      </GraphBlock>
    );
  };

  return (
    <GraphCanvas
      graph={graph}
      renderBlock={renderBlockFn}
      onStateChanged={({ state }) => {
        if (state === GraphState.ATTACHED) {
          start();
          graph.zoomTo("center", { padding: 300 });
        }
      }}
    />
  );
}
Vanilla JavaScript の例
import { Graph } from "@gravity-ui/graph";

// コンテナ要素を作成
const container = document.createElement('div');
container.style.width = '100vw';
container.style.height = '100vh';
container.style.overflow = 'hidden';
document.body.appendChild(container);

// 設定でグラフを初期化
const graph = new Graph({
    configurationName: "example",
    blocks: [],
    connections: [],
    settings: {
        canDragCamera: true,
        canZoomCamera: true,
        useBezierConnections: true,
        showConnectionArrows: true
    }
}, container);
// ブロックと接続を追加
graph.setEntities({
    blocks: [
        {
            is: "block-action",
            id: "block1",
            x: 100,
            y: 100,
            width: 120,
            height: 120,
            name: "ブロック #1",
            anchors: [
                {
                    id: "out1",
                    blockId: "block1",
                    type: EAnchorType.OUT,
                    index: 0
                }
            ]
        },
        {
            is: "block-action",
            id: "block2",
            x: 300,
            y: 300,
            width: 120,
            height: 120,
            name: "ブロック #2",
            anchors: [
                {
                    id: "in1",
                    blockId: "block2",
                    type: EAnchorType.IN,
                    index: 0
                }
            ]
        }
    ],
    connections: [
        {
            sourceBlockId: "block1",
            sourceAnchorId: "out1",
            targetBlockId: "block2",
            targetAnchorId: "in1"
        }
    ]
});

// レンダリングを開始
graph.start();

// ビューを中央に配置
graph.zoomTo("center", { padding: 100 });
ライブデモ
ドキュメント
目次
-
システム
-
コンポーネント
-
レンダリング
-
ブロックと接続
ライブラリについて
メンテナー